But I don’t and never will make money from this site, so why would I care how many visits it gets?
A highly-viewed post indicates to me that the topic is worth talking about. It’s a signal that it might be worth writing more about that thing in future. Popular posts might also need updating over time to keep the information up to date.
So I think I have a use case. Except I don’t want to ‘track’ people; I just want to count visits and views.
Friendship ended
I’ve been using Google Analytics for this blog since it began in April 2018. Why? My naïve reasons were that it’s free, it’s ubiquitous and it’s easily implemented in {blogdown}.
It’s massively bloated for my use case though. Acquisition reports, revenue per user and cohort analysis are not relevant to me. And I don’t even know what they mean.
More importantly, I’m uncomfortable with various privacy concerns around the company and platform. I don’t need or want you to be the product.
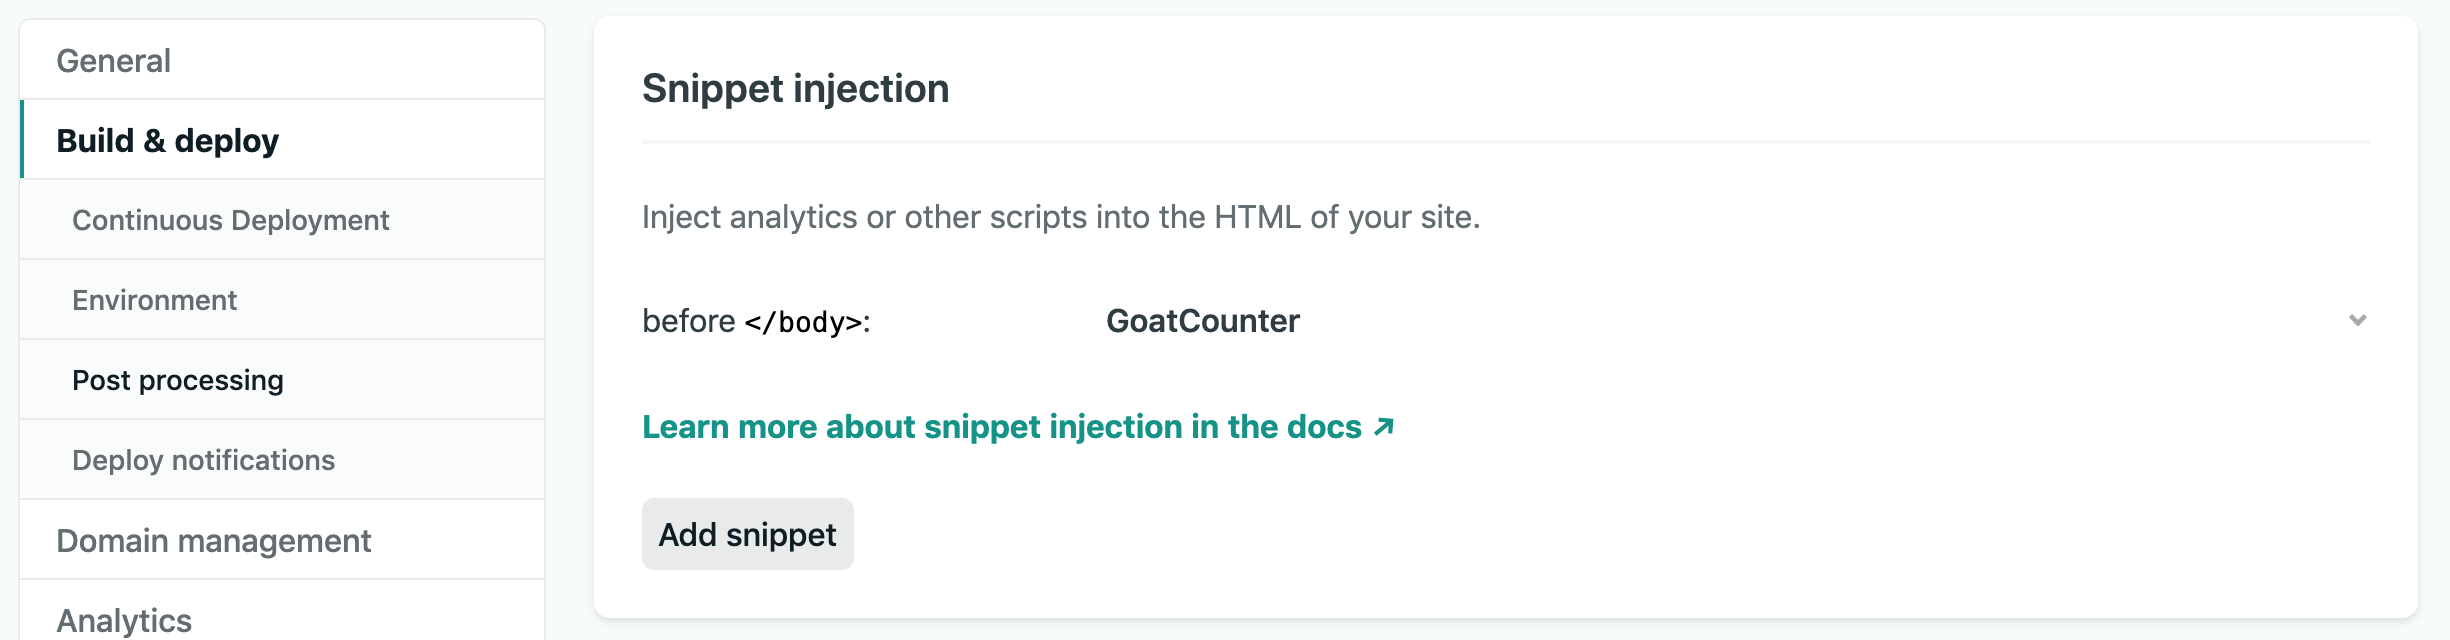
This blog was created with the R package {blogdown}, which is built on the Hugo static site generator, and it’s deployed via Netlify. Your mileage may vary, but there were basically three steps:
Your stats will then be available from a URL in the form https://yoursite.goatcounter.com, which you set during the sign-up process.
Now you can start counting sheep. Er… goats.
Greatest Of All Time (GOAT)
The switch does mean I’ll lose cumulative view counts for posts that already exist, but I’m not bothered about that. I can always export the Google Analytics data and manually add it to GoatCounter’s counts.
For interest, here’s the most viewed posts as counted by Google Analytics:
In particular, the post about {R6} is a good example of something I wanted to learn and then blog about for posterity. I think the timing helped in people viewing it, since Animal Crossing: New Horizons had just been released to great fanfare. To illustrate the ‘zeitgeistiness’, this post had the highest view spike of any post and has settled down a great deal since then.
When you’ve written the same code 3 times, write a function. When you’ve given the same in-person advice 3 times, write a blog post
Given its popularity, I also decided to overhaul it to make it more simple and accessible. It also led to a later post on parameterised R Markdown reports, which I think is actually the better solution in most cases.
I wouldn’t have known any of this without having a record of page views, but the method for collecting that data no longer grinds my goat.
Environment
Session info
Last rendered: 2023-11-26 15:40:57 GMT
R version 4.3.1 (2023-06-16)
Platform: aarch64-apple-darwin20 (64-bit)
Running under: macOS Ventura 13.2.1

Matrix products: default
BLAS:   /Library/Frameworks/R.framework/Versions/4.3-arm64/Resources/lib/libRblas.0.dylib
LAPACK: /Library/Frameworks/R.framework/Versions/4.3-arm64/Resources/lib/libRlapack.dylib;  LAPACK version 3.11.0

locale:
[1] en_US.UTF-8/en_US.UTF-8/en_US.UTF-8/C/en_US.UTF-8/en_US.UTF-8

time zone: Europe/London
tzcode source: internal

attached base packages:
[1] stats     graphics  grDevices utils     datasets  methods   base

loaded via a namespace (and not attached):
 [1] htmlwidgets_1.6.2 compiler_4.3.1    fastmap_1.1.1     cli_3.6.1
 [5] tools_4.3.1       htmltools_0.5.6.1 rstudioapi_0.15.0 yaml_2.3.7
 [9] rmarkdown_2.25    knitr_1.45        jsonlite_1.8.7    xfun_0.41
[13] digest_0.6.33     rlang_1.1.1       fontawesome_0.5.2 evaluate_0.23
This is provided to you by GoatCounter when you set up an account, but it’s just in the form <script data-goatcounter="https://yoursite.goatcounter.com/count" async src="//gc.zgo.at/count.js"></script>.↩︎